Genetik & Genomik der Pflanzen

Zusätzliche Daten
- Corrected figures for Zimmermann et al. (2004) TPJ 40:22-34
The figures shown below were prepared for the paper Zimmermann et al. 2004 (in The Plant Journal). For reasons that are not really clear, the published version of the paper contained "pre-final" versions of figures 1 and 6. You will need the paper text to get the info from the figures. The published paper text refers to the figures in the versions shown here, the figures in the paper miss data regarding TTG1 (figure 1) or contain different aa number labels (figure 6).
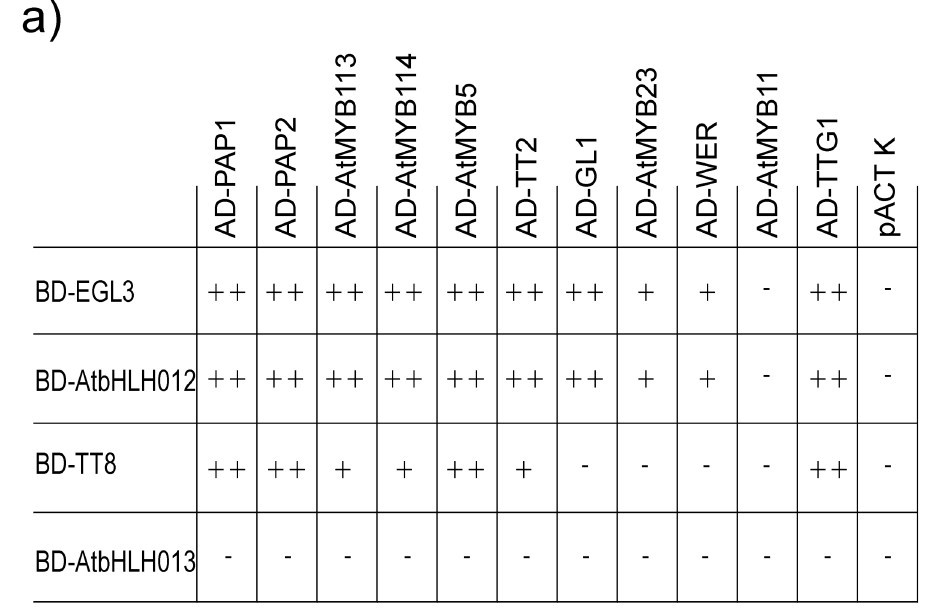
Figure 1

a) Yeast two-hybrid analysis of MYB-BHLH interactions
BHLH proteins were fused to the GAL4 binding domain (BD) and assayed for their ability to bind TTG1 and the MYB proteins fused to the GAL4 activation domain (AD). The interaction strength indicated in the matrix was estimated by comparing the growth of yeast cells on triple dropout media supplemented with 3, 20 and 40 mM 3-aminotriazole (3-AT), respectively. pACT K was used in order to check whether the BHLH proteins contain a functional activation domain in yeast. The BHLH proteins of subgroup IIId and IIIe did not interact with TTG1 (exemplarily the test with AtBHLH013 is shown). AtMYB12 and AtMYB111, MYB proteins of subgroup 7 were tested as well but show results similar to AtMYB11 (no interaction with R/B-like BHLH proteins).++, growth at 20 mM 3-AT; +, growth at 3 mM 3-AT; -, no growth on triple dropout media containing 3 mM 3-AT.
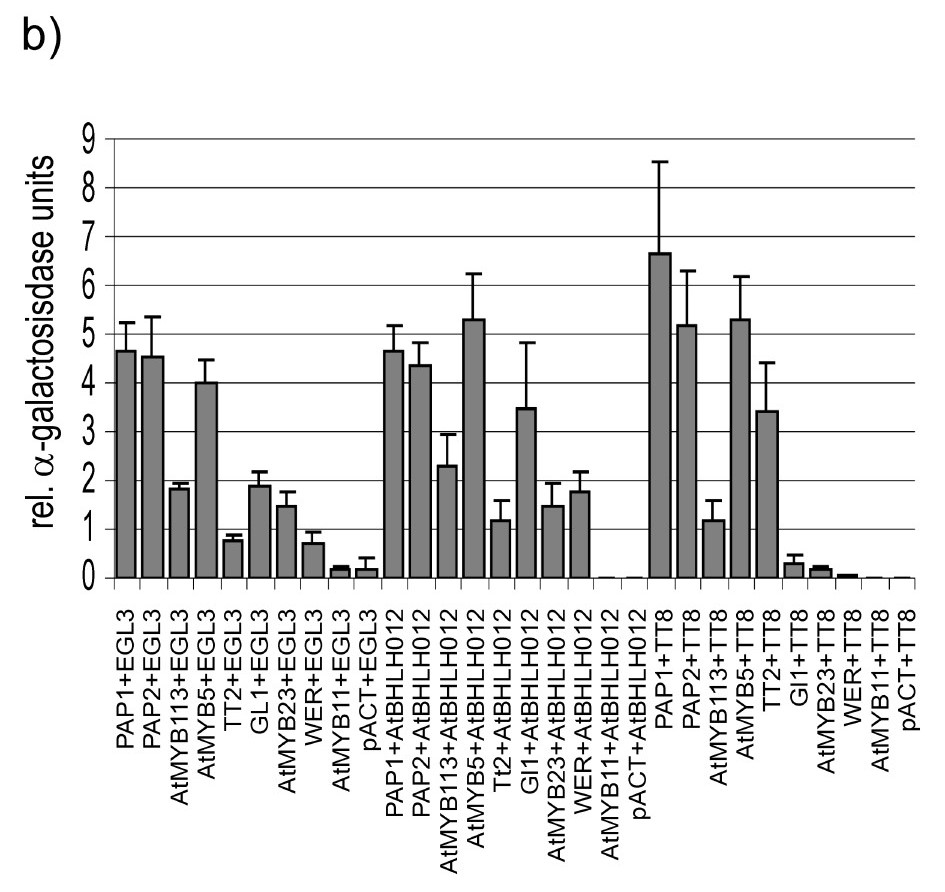
b) Semiquantitative assay of interaction strength
a-galactosidase assays of yeast strains expressing combinations of BHLH and MYB proteins fused to the GAL4 binding and activation domain, respectively. Results shown represent the mean values of 12 independent a-galactosidase-assays.
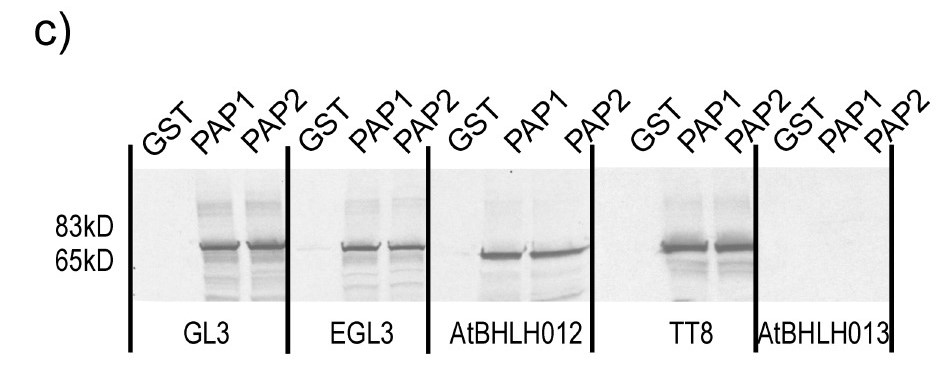
c) In vitro pull down assay.
Binding of PAP1/AtMYB75 and PAP2/AtMYB90 to GL3/AtBHLH001, EGL3/AtBHLH002, AtBHLH012, TT8/AtBHLH042 and AtBHLH013. MYB proteins were expressed as GST fusion proteins. Fusion proteins were re-immobilized on GSH agarose beads and incubated with [35S]methionine-labelled BHLH proteins synthesized in a coupled transcription-translation system. As a negative control beads were loaded with GST. After extensive washing, bound proteins were analysed by SDS-PAGE. [35S]-labelled proteins were detected by autoradiography.
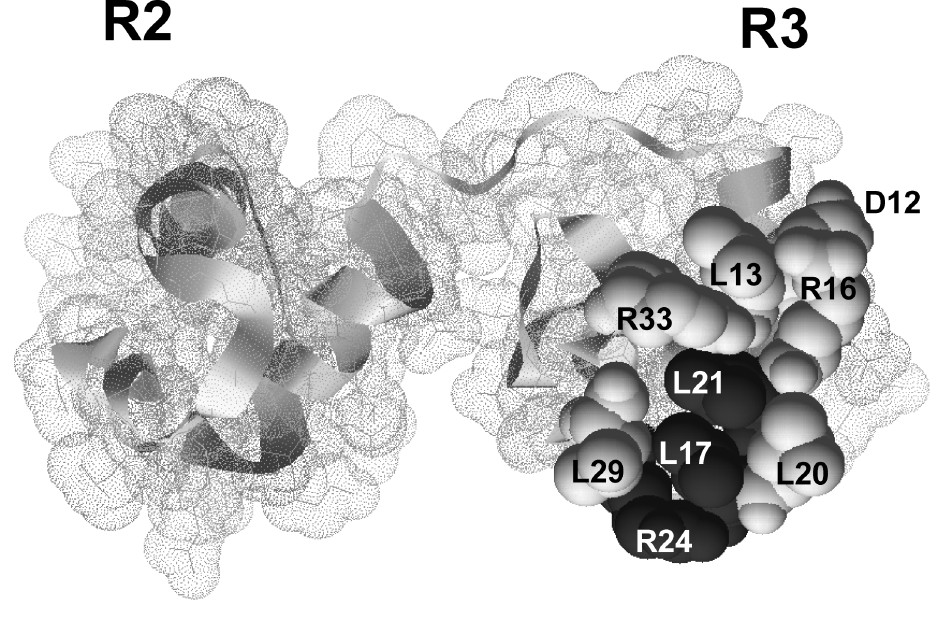
Figure 6
Model of the PAP1/AtMYB75 R2R3-MYB domain on the basis of the NMR structure of the MYB domain of c-MYB (Ogata et al., 1994).
Amino acids which are elements of the motif [DE]Lx2[RK]x3Lx6Lx3R are highlighted (light grey) and named according to their position in the PAP1/AtMYB75 sequence. The positions 12, 13, 16, 17, 20, 21, 24, 29 and 33 correspond to the amino acids D72, L73, R76, L77, L80, L81, R84, L87 and R91 of PAP1, respectively. Amino acids conserved throughout Arabidopsis thaliana MYB proteins are coloured in dark grey. Amino acids involved in interaction are solvent-exposed, forming a characteristic pattern positioned on the surface opposite to the DNA binding site.
- Additional data for Wisman et al. (1998) PNAS 95:12432-12437
The figure was prepared for the paper Wisman et al. 1998 (in PNAS) but had to be removed due to length constrains. It is cited in the text as "data not shown". You will need the paper text to get the info from the figure.
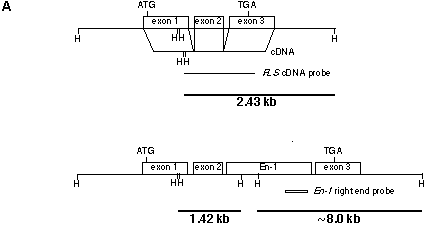
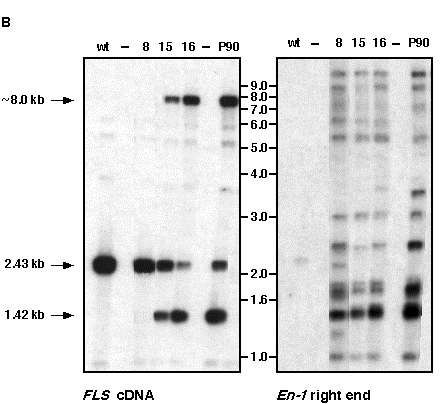
(A) Schematic representation of the FLS gene and the En-1 insertion allele. The fragments resulting from a HindIII digest of genomic DNA which are detected by the FLS cDNA probe are indicated with sizes given in kb. The position of the En-1 right end probe (small open rectangle) is also indicated.
(B) Identification of homo- and heterozygous plants, detection of somatic reversion events, and prove of line identity by DNA gel-blot analysis. Results from a DNA gel-blot analysis of offspring (lanes labelled 8, 15, and 16) of plant 14 and of P90 (parent of plant 14). Col-wt genomic DNA is included as control; all digested with HindIII. Probes are given below the autoradiograms. Bands corresponding to the fragments highlighted in (A) are marked in the left panel. The three offspring plants were selected to include each genotype once. The wildtype-sized FLS band (2.43 kb) detected in two fls-1::En/fls-1::En plants (lanes labelled P90 and 16) is derived from somatic reversion events. The right panel shows that all plants are derived from the initial mutant isolated.