Nachhaltigkeitsbericht 2023

Treibhausgasemissionen
Key Facts
Die Universität Bielefeld bilanziert ihre Treibhausgasemissionen (THG-Emissionen) nach dem „Greenhouse Gas Protocol“-Standard mit Berücksichtigung der Emissionen in den Bereichen Scope 1, Scope 2 und Scope 3. Im Jahr 2019 emittierte die Universität Bielefeld insgesamt 21.801 Tonnen CO2-Äquivalente nach dem marktbezogenen Ansatz (Verweis: Bilanzierungsmethodik). Dies entspricht 0,76 Tonnen CO2-Äquivalente pro Universitätsmitglied.
Von den Gesamtemissionen sind rund 61 % auf den Bereich Scope 3, 36 % auf den Bereich Scope 2 und 3 % auf den Bereich Scope 1 zurückzuführen. Die größten Emissionsquellen sind die Pendelwege der Universitätsangehörigen (Scope 3), der Bezug von Strom und Fernwärme (Scope 2), Dienstreisen (Scope 3) und die stationäre Verbrennung von Erdgas (Scope 1).
2019 als Referenzjahr
Aufgrund der durch die Corona-Pandemie bedingten Verzerrung emissionsrelevanter Aktivitäten wird 2019 als Referenzjahr herangezogen. Um dennoch eine Entwicklung darzustellen, finden sich im Anhang auch Kennzahlen für die Jahre 2020 und 2021. Dabei ist jedoch zu beachten, dass aufgrund fehlender Emissionsfaktoren und Daten einzelne Angaben fehlen.
- Klimaschutzziele
Die Universität Bielefeld strebt an, bis zum Jahr 2035 bilanzielle Treibhausgasneutralität1 gegenüber dem Jahr 2019 zu erreichen, sofern die Landesregierung die in ihrer Verantwortung liegende Umsetzung und Finanzierung der notwendigen infrastrukturellen Anpassungen trägt. Unter dieser Bedingung soll anlehnend an die Ziele des Pariser Klimaabkommens2 eine Reduzierung der Treibhausgasemissionen gegenüber 2019 um 40 % bis 2025, um 60 % bis 2027 und um 82 % bis 2030 erreicht werden. Diese Ziele hat die Universität im Nachhaltigkeitsleitbild festgelegt.
1 Bilanzielle Treibhausgasneutralität bedeutet, dass die im Rahmen der Treibhausgas-Bilanzierung erfassten klimawirksamen Emissionen vermieden und reduziert sowie durch die entsprechende Aufnahme an anderer Stelle kompensiert werden, um einem Konzentrationsanstieg von Treibhausgasen in der Erdatmosphäre entgegenzuwirken („Netto-Null-Emissionen“).
2 Bei der 21. UN-Klimakonferenz in Paris im Dezember 2015 hat sich die Staatengemeinschaft dazu verpflichtet, die Erderwärmung auf deutlich unter 2 °C, möglichst auf 1,5 °C, gegenüber dem vorindustriellen Niveau zu begrenzen.
- Bilanzierungsmethodik Treibhausgasbilanz
Die Treibhausgasbilanz dient zur Erfassung des Ist-Zustands der Emissionen der Universität Bielefeld. Aufgrund der durch die Corona-Pandemie bedingten Verzerrung emissionsrelevanter Aktivitäten wird 2019 als Referenzjahr herangezogen. Emissionen, die durch die Vermietung von Gebäudeflächen an das Studierendenwerk und die Hochschule Bielefeld entstehen, werden in der Treibhausgasbilanz nicht berücksichtigt.
Die Bilanzierung der Treibhausgasemissionen der Universität Bielefeld erfolgt nach dem international anerkannten „Greenhouse Gas Protocol“-Standard (GHG Protocol). Das GHG Protocol teilt Emissionen in drei Geltungsbereiche auf: Scope 1, Scope 2 und Scope 3.
Die Universität Bielefeld erfasst alle Emissionen in den Bereichen Scope 1 und Scope 2. Die Emissionen im Bereich Scope 3 werden in Abhängigkeit von der Datenverfügbarkeit so umfassend wie möglich ermittelt. Mit zunehmender Datenverfügbarkeit soll der Bereich Scope 3 sukzessiv erweitert werden. Aktuell werden die unten aufgeführten Aktivitäten betrachtet:
„Scope 1“-Emissionen sind direkte Emissionen aus eigenen oder kontrollierten Quellen, d. h. überwiegend Emissionen, die innerhalb der Grenzen der Universität entstehen.
„Scope 2“-Emissionen sind indirekte Emissionen aus der Erzeugung zugekaufter Energie. Die Darstellung der „Scope 2“-Emissionen erfolgt nach dem sogenannten „Dual Reporting“-Prinzip, d. h. dass die Emissionen sowohl nach dem ortsgebundenen als auch nach dem marktbezogenen Ansatz dargestellt werden. Der ortsgebundene Ansatz berechnet die Emissionen des Strombezugs unter Berücksichtigung des Bundesstrommix, sodass regionale Unterschiede ausgeglichen werden und somit eine bessere Vergleichbarkeit der Zahlen gewährleistet wird. Der marktbezogene Ansatz ermittelt die Emissionen des Strombezugs unter Berücksichtigung des jeweiligen Stromliefervertrags, sodass individuelle Endscheidungen wie zum Beispiel der Bezug von Strom aus erneuerbaren Energiequellen in die Treibhausgasbilanz mit einfließen.
„Scope 3“-Emissionen sind alle sonstigen indirekten Emissionen, die in der Wertschöpfungskette der Universität entstehen. Während das GHG Protocol seine Anwender*innen zur Erfassung der Emissionen aus den Bereichen Scope 1 und Scope 2 verpflichtet, ist die Erfassung der Emissionen aus dem Bereich Scope 3 freigestellt.
Aktuell werden die folgenden Aktivitäten betrachtet:

© Universität Bielefeld Hinweis: Für Universitäten und Hochschulen gibt es derzeit keine einheitliche Vorschrift oder Regelung zur Bilanzierung der THG-Emissionen. Beim Vergleich mit anderen Hochschulen sind also Unterschiede in den Basisjahren, Systemgrenzen und der Anwendung der Bilanzierungsstandards zu berücksichtigen.


Gesamtemissionen
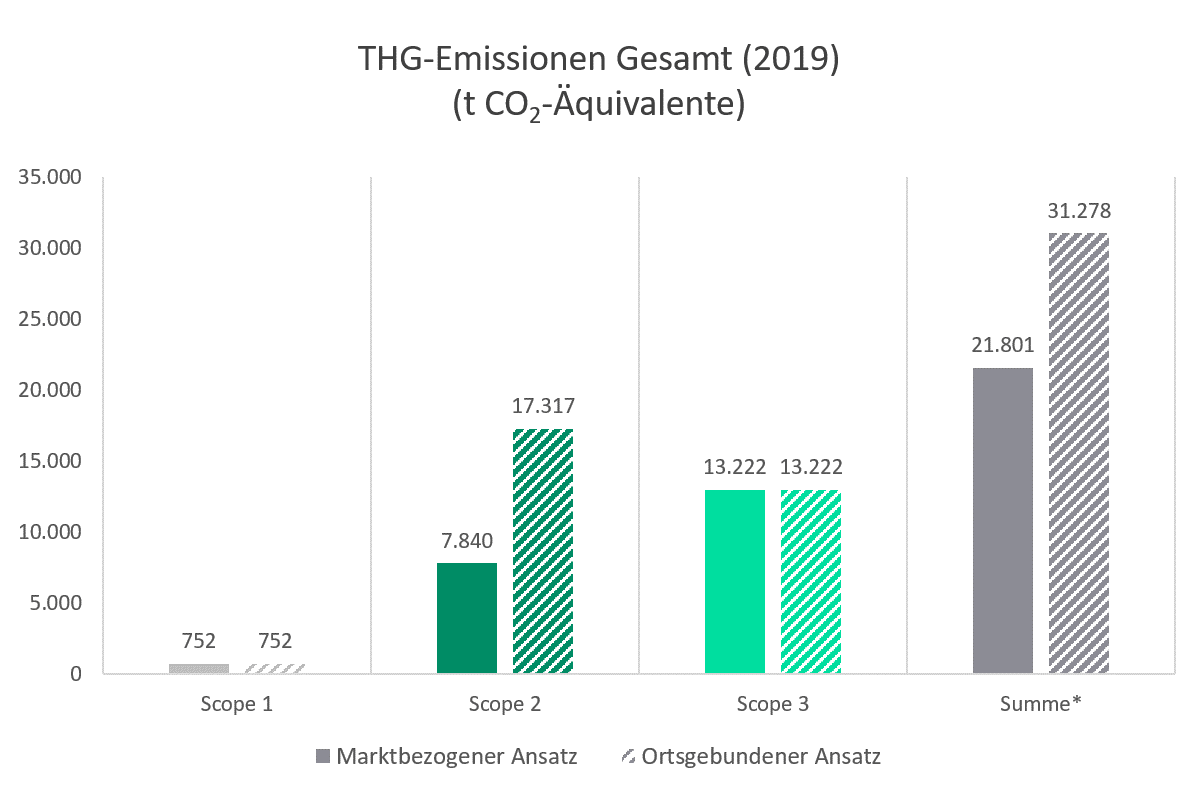
Unter Berücksichtigung der Systemgrenzen emittierte die Universität Bielefeld im Jahr 2019 insgesamt 31.278 Tonnen CO2-Äquivalente nach dem ortsgebundenen Ansatz und 21.801 Tonnen CO2-Äquivalente nach dem marktbezogenen Ansatz (siehe Abschnitt „Bilanzierungsmethodik Treibhausgasbilanz“).
Die Emissionen nach dem marktbezogenen Ansatz fallen deutlich geringer aus, da die Universität Bielefeld bereits im Jahr 2019 Strom bezog, der zu 62 % aus erneuerbaren Energiequellen stammte. Seit 2020 bezieht die Universität Bielefeld Strom aus 100 % erneuerbaren Energiequellen. Im Folgenden werden die Ergebnisse nach dem marktbezogenen Ansatz als Hauptvariante ausgewiesen.
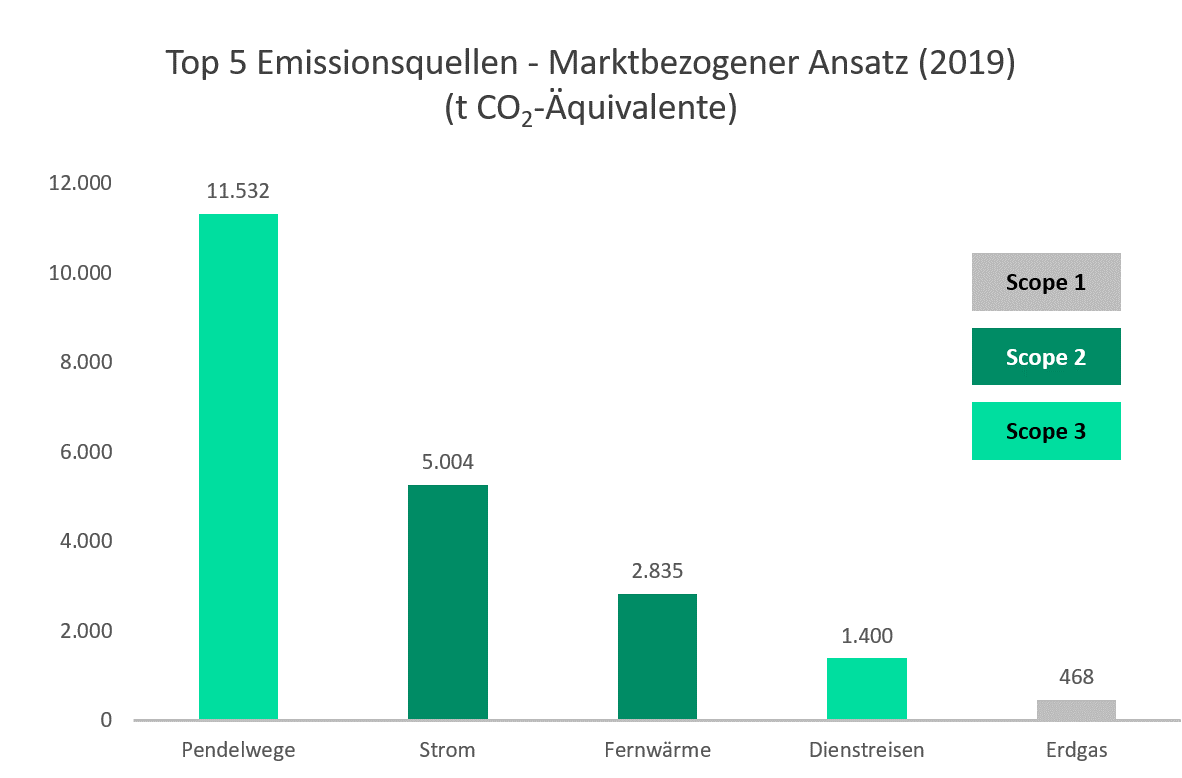
Die nebenstehende Abbildung zeigt die fünf größten Emissionsquellen der Universität nach dem marktbezogenen Ansatz. Die vollständigen Treibhausgasbilanzen sind im Anhang einsehbar.
Emissionen nach Geltungsbereich (Scope)

Aufgeteilt auf die drei Scopes des GHG Protocols sind die Emissionen des Jahres 2019 in der nebenstehenden Abbildung nach dem marktbezogenen Ansatz ersichtlich. Es wird deutlich, dass die Scopes sich hinsichtlich des Anteils an der Gesamtbilanz stark unterscheiden. In Scope 1 fielen insgesamt 752 Tonnen CO2-Äquivalente an. Auf Scope 2 sind 7.840 Tonnen CO2-Äquivalente zurückzuführen. Mit 13.222 Tonnen CO2-Äquivalente hat Scope 3 den größten Anteil an den Gesamtemissionen. Hier ist zu betonen, dass Aktivitäten in Scope 3 teilweise auf Annahmen und groben Hochrechnungen basieren, wie z. B. der Bereich der Pendelwege der Universitätsangehörigen.
Emissionen pro Hochschulmitglied
Im Zuge der geplanten Fortschreibung der Treibhausgasbilanz der Universität Bielefeld ist die Betrachtung relativer Kennzahlen unerlässlich, um Entwicklungstrends transparent darstellen zu können. Die Emissionen pro Hochschulmitglied berücksichtigen das Wachstum der Universität im Sinne des Zulaufs von Studierenden, Forschenden & Lehrenden und Mitarbeiter*innen in Technik & Verwaltung sowie entsprechend des Baus und der Inbetriebnahme neuer Gebäude. Vor allem im Zuge des Aufbaus des Campus Süd wird die Universität Bielefeld in den nächsten Jahren wachsen. Daher ist es hinsichtlich des Klimaschutzes unabdingbar, die Emissionen im Verhältnis zur Zahl der Universitätsangehörigen zu verfolgen.
Im Referenzjahr 2019 bezifferten sich die Emissionen pro Universitätsmitglied auf 0,76 Tonnen CO2-Äquivalente nach dem marktbezogenen Ansatz. Wie bereits erwähnt, wurden die Jahre 2020 und 2021 durch die Corona-Pandemie stark verzerrt. Dies wirkt sich sowohl auf die energiebedingten als auch auf die mobilitätsbedingten Emissionen aus. So konnte zum Beispiel der Bereich Pendelwege aufgrund der Datenlage nicht in die Bilanz mit einfließen.